Know what's actually happening in your business.
Sales, categories, payments, and margins — broken down enough to act on, rolled up enough to see the whole picture, for one branch or every branch at once.
Sales reports that go beyond a daily total
See sales broken down by category, by product, by staff member, or by time period — not just a single number for the day. Instant Sales gives you a live read on how today's actually going; the fuller Sales Report lets you compare across any date range you choose.
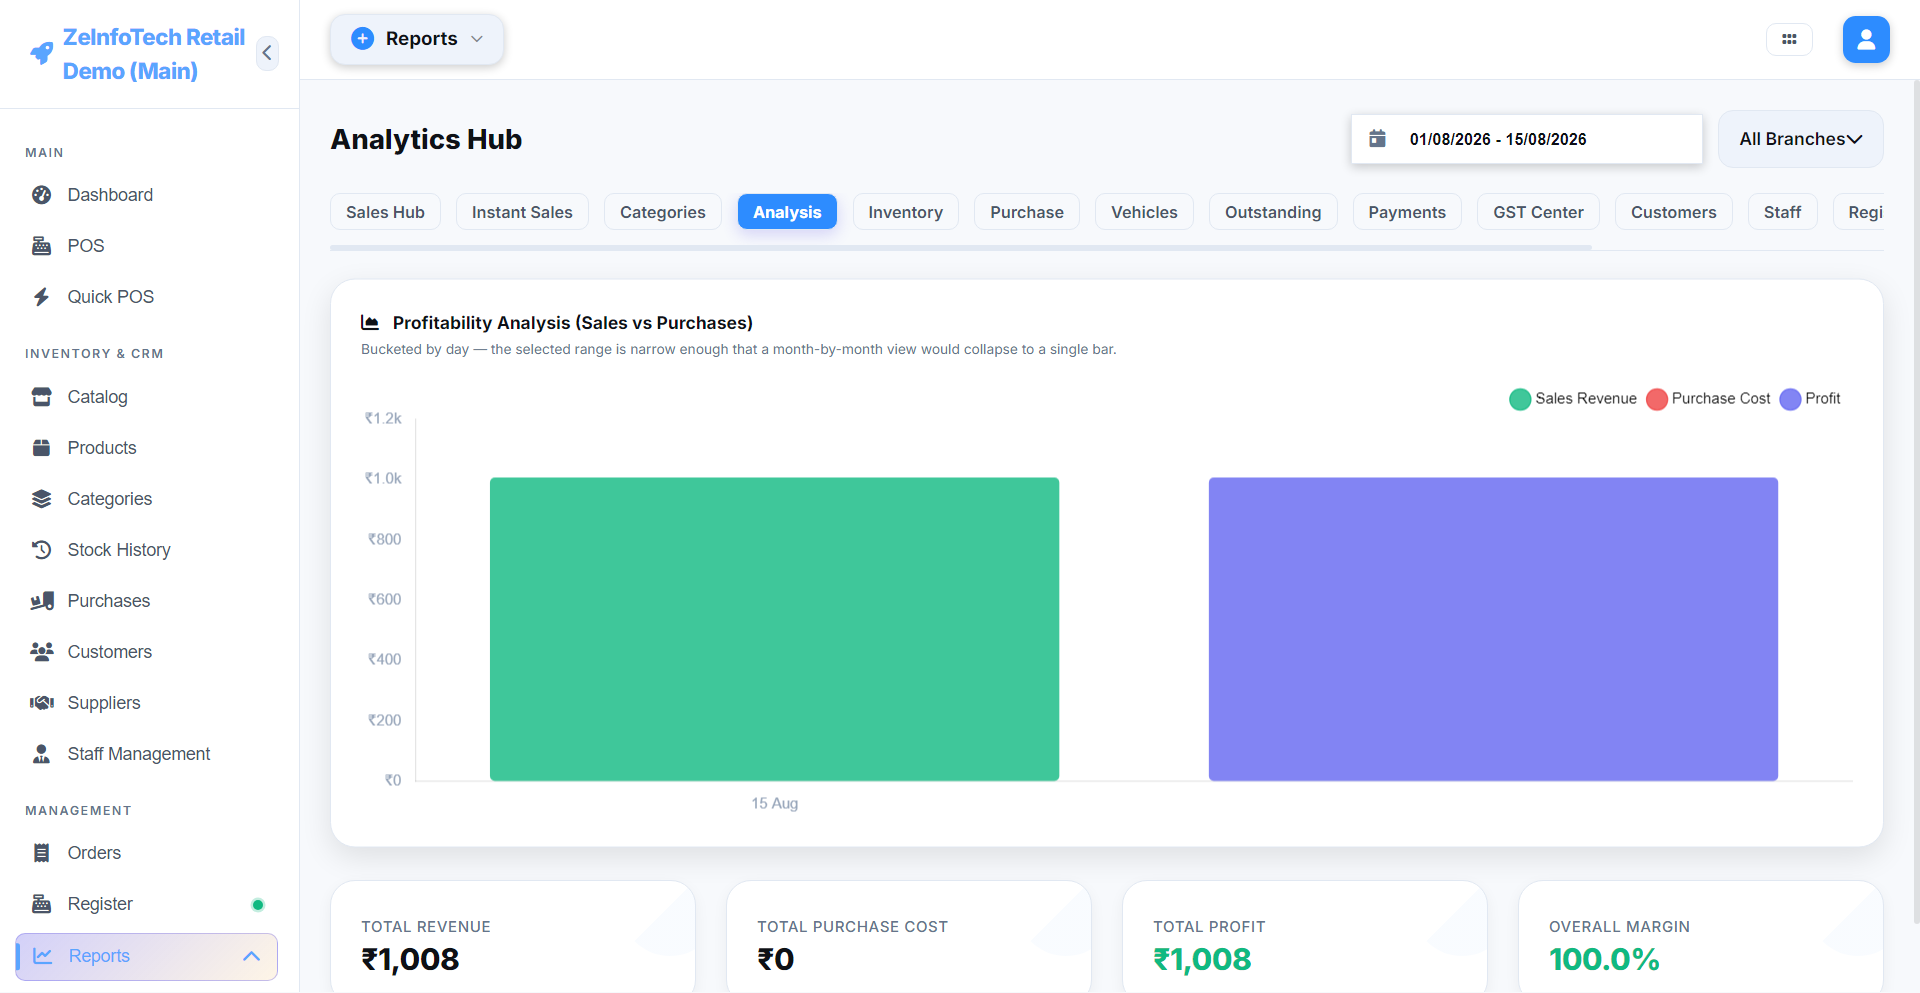
Business Analysis, not just raw numbers
Beyond straight sales totals, the Business Analysis view surfaces trends — what's actually moving, what's slowing down — so decisions about what to stock more (or less) of are based on your own data instead of a gut feeling.
Payments, broken down by method
See exactly how much came in as Cash, UPI, or Card, per day or per range — useful for reconciling the till and understanding how your customers actually prefer to pay.
Sales Reports
By product, category, staff, or custom date range.
Category Sales
See which categories are actually driving revenue.
Business Analysis
Trend views beyond a flat daily total.
Instant Sales
A live read on how today is going, right now.
Payment method breakdown
Cash vs. UPI vs. Card, reconciled per day.
Per-branch or rolled up
Filter to one location, or see everything together.
See real reports, not mockups
The live demo comes pre-loaded with sample sales data across categories and dates.